uChart
Lightweight, canvas‑based charting library written in TypeScript, designed for real‑time data streams and small bundle size.
Features
- 💡 Zero external deps – plain
<canvas> - ⚡ Real‑time friendly – redraws only what’s needed
- 📦 ESM ready – authored as native ES modules
- 📝 TypeScript types included (
*.d.ts) - 🎛️ Configurable axes, ticks, colors, date formatting & cursor read‑outs
Options
The createChartElement(seriesList, options) function supports the following options:
| Option | Type | Description |
|---|---|---|
width |
number |
Fixed chart width in pixels (optional, defaults to container width) |
height |
number |
Fixed chart height in pixels (optional, defaults to container height) |
min |
number |
Minimum Y-axis value (optional, auto-computed if not set) |
max |
number |
Maximum Y-axis value (optional, auto-computed if not set) |
showYAxis |
boolean |
Whether to render Y-axis ticks and labels |
yTicks |
number |
Number of Y-axis ticks (default: 5) |
backgroundColor |
string |
Optional background fill color |
maxTimeDelta |
number | null |
Gap in ms that breaks line continuity (default: 600) |
dateFormat |
(ts: number) => string |
Custom formatter for the cursor timestamp label |
// Example: format timestamp to full Czech date+time
dateFormat: (ts) => new Date(ts).toLocaleString('cs-CZ', {
    hour: '2-digit',
    minute: '2-digit',
    second: '2-digit',
    day: '2-digit',
    month: '2-digit',
    year: 'numeric'
})
Installation
npm install @meteolab/uchart
Quick strart
<!-- test.html (included in the repo) -->
<!DOCTYPE html>
<html lang="en">
<head>
<meta charset="UTF-8" />
<title>uChart Interactive Test</title>
<style>
#chartContainer { width: 1000px; height: 400px; margin: 20px auto; background:#111; }
body { background:#222; }
</style>
</head>
<body>
<div id="chartContainer"></div>
<script type="module">
import { createChartElement } from './dist/uchart.js';
const container = document.getElementById('chartContainer');
const chart = createChartElement([], {
showYAxis: true,
yTicks: 5,
dateFormat: (ts) => new Date(ts).toLocaleString('cs-CZ', {
hour: '2-digit',
minute: '2-digit',
second: '2-digit',
day: '2-digit',
month: '2-digit',
year: 'numeric'
})
}); container.appendChild(chart.element);
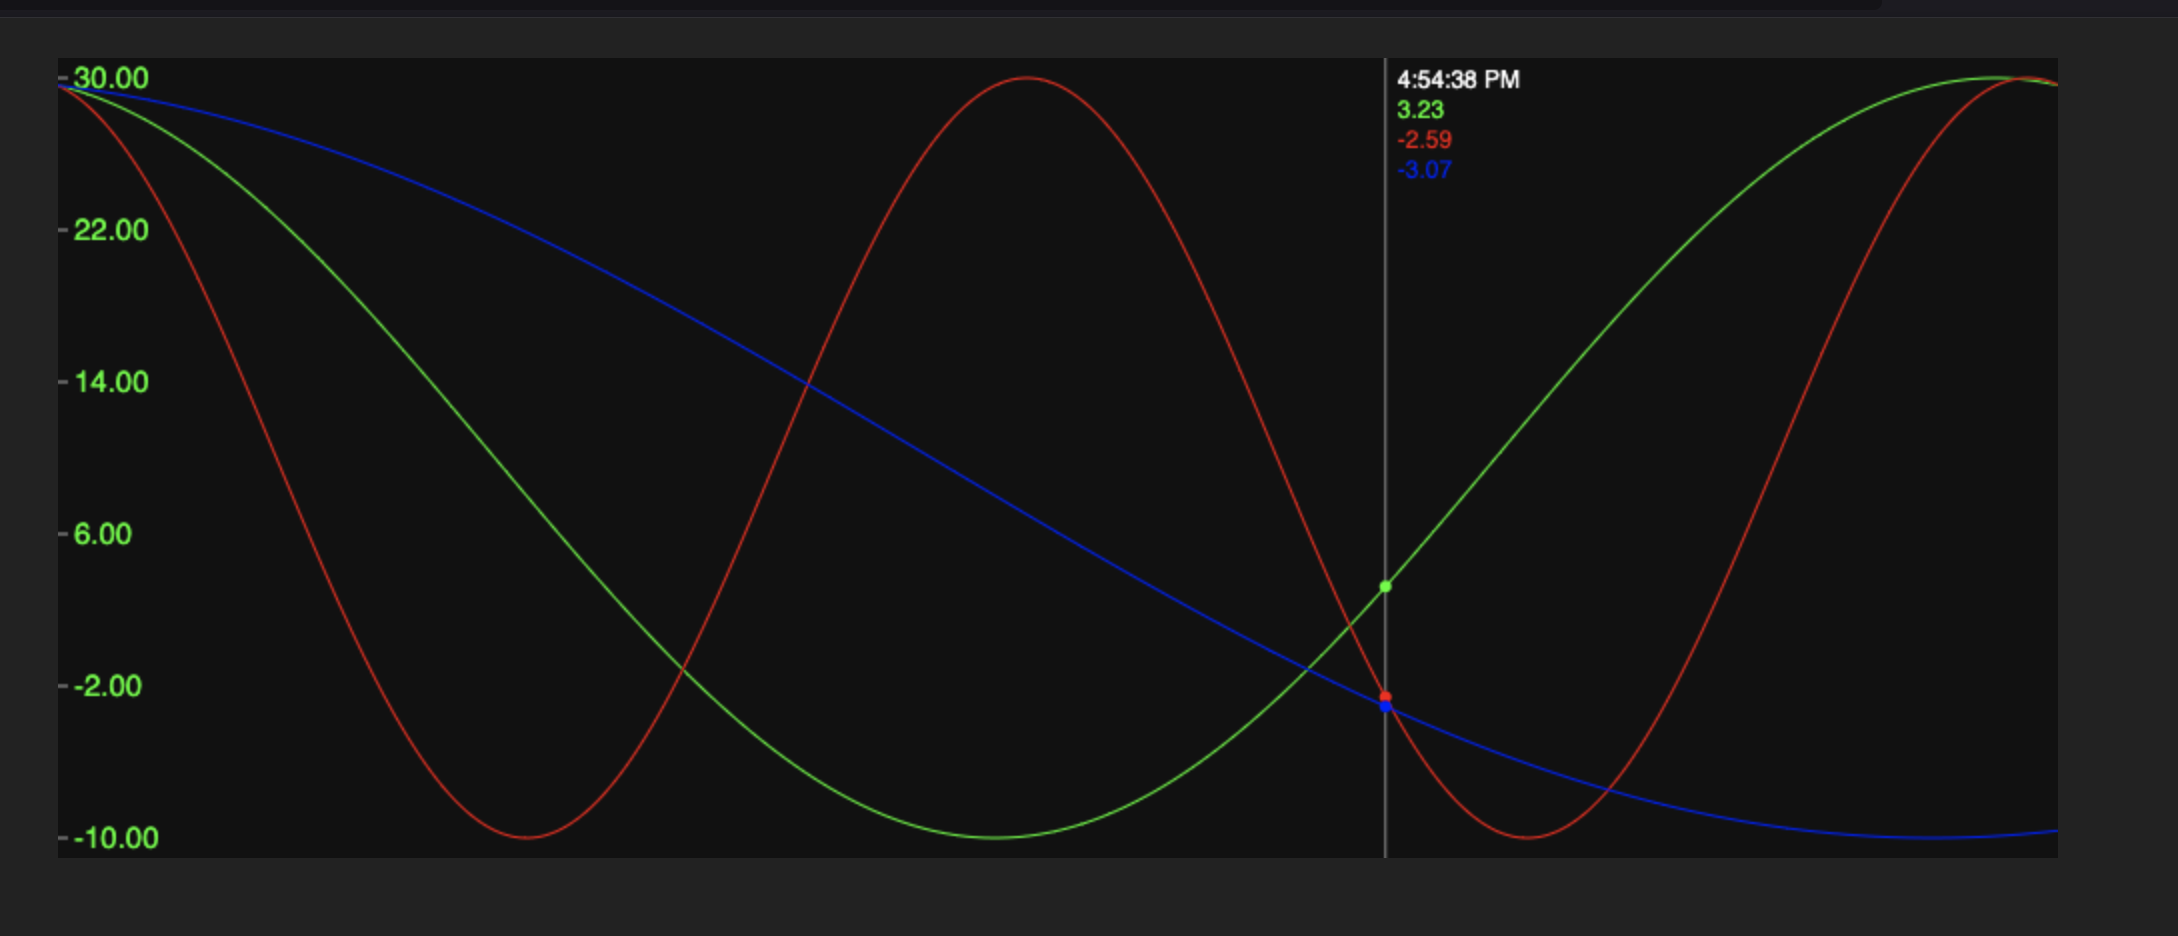
let phase = 0;
function generateSineSeries(len, shift, amp, off, freq = 1){
const now = Date.now();
const data=[];
for(let i=0;i<len;i++){
const t = now + i*10;
const x = i/len*2*Math.PI*freq;
const y = Math.sin(x+shift)*amp + off;
data.push([t,y]);
}
return data;
}
function update(){
chart.setSeries([
{ data: generateSineSeries(1500, phase, 20, 10, 1), strokeColor:'#0f0' },
{ data: generateSineSeries(1500, phase, 20, 10, 2), strokeColor:'#f00' },
{ data: generateSineSeries(1500, phase, 20, 10, 0.5), strokeColor:'#00f' }
]);
phase += 0.01;
}
update()
setInterval(update, 50);
</script>
</body>
</html>
Test
During development you can run a live dev server:
npm run serve